Alberta Scardapane, SEO Specialist and full-stack developer
Welcome to AlbertaOS, my portfolio. I work from Lanciano, in Abruzzo, Italy: remotely across the whole country, on site or hybrid across Abruzzo, Marche and Molise. I do two things: I build custom business software that companies run on every day, and websites that have to be found on Google.
What is inside
Four projects in production, and each one has its own app in this portfolio.
Apps open from their icons, and every one of them has something you can try: book a sunbed, move an enrolment request forward, scan a QR code.
One honest note
The apps in this portfolio are reworkings, built here in a few lines of code, so that ten seconds are enough to see what each piece of software does. The real screenshots of the real projects are in the Photos app.
This portfolio is written in HTML, CSS and JavaScript, with no frameworks and no libraries.
Management software for beach resorts. Before it, the two clubs running on it worked with pen and paper, and a paper register always carries the same problems: the same sunbed sold twice, the promise made over the phone that nobody remembers, the takings that do not add up at the end of the day. Today that sunbed sits on a map everyone sees updated at the same moment.
The whole ecosystem is mine, developed from October 2024 and launched in May 2026: six components that talk to each other, including the CRM I use to follow every installation and the product site itself, lidomatic.it.
reworking · click the umbrellas to book or release them
Bookings come in from two directions and meet on the same map. The first is the till, on the desktop application for Windows and macOS, where staff assign a pitch to the customer standing there or calling in. The second is the club's own website: with the WordPress and WooCommerce plugin I built, a customer books from home and the pitch shows as taken at the till, with nothing to key in by hand.
Out on the sand the staff carry a tablet running the viewer, built for looking things up: whoever is walking between the umbrellas sees the current map without going back to the till, over the local network or from outside through an encrypted tunnel.
When something breaks
If the line goes down the club keeps working, because the database lives on the till's own computer and not on a remote server. If the problem is the software instead, I see it: from the CRM I built I check licences and the state of every installation, remote diagnostics included. Usually I notice before anyone calls me. Updates install themselves, and not everyone gets the same ones: there is more than one release channel, depending on the plan the customer chose.
What is inside the application
Daily, weekly, monthly and seasonal price lists, separated by pitch type: parasols, palm shades and gazebos have their own prices and their own rules. Single and group bookings, cabins, tickets and vouchers, payments and balances. Multiple users with roles and PINs, because the person at the till is not always the same one. Statistics with a heat map of the most requested pitches, PDF export, map printing, a user guide inside the app and the legal documents already included.
Lidomatic is still evolving, and important new features are due for the 2027 season.
CRM FAMA in production · v96
A CRM for a university guidance centre. Before it, the details of one person lived in different systems that did not talk to each other, so nobody had the full picture of a case. The CRM keeps them in one place, from the form filled in on the website to the enrolment confirmed by the institution, and it holds several education providers together, each with its own catalogue and its own rules.
reworking · click a card to move it along the pipeline
From seven directions: the contact form on the site, the instalment calculator, the guidance tests, manual entry, a Telegram bot, a social conversation turned into a request, and the automations. All seven go through the same duplicate check, because duplicates are always created at the door, and fixing them later costs ten times as much.
The check works on two levels. Tax code, email and phone say it is the same person. A matching name only warns and never blocks: people do share names, and the same person asking again months later about a different course is not a mistake to be corrected.
Recognising that two things are the same thing
The hardest part of this project is not the CRM, it is working out when two records are the same thing. The same person arrives from the website with one email address and from the institution's portal with another. The same course changes its code every academic year. The same case has different identifiers depending on where you look at it. A good share of the releases of these months is exactly that work: one real case at a time, deciding when two things should be merged and when it is right that they stay apart.
The browser extension
Each institution that runs the courses has its own portal, and none of them offers an automatic way to find out how a case ended: the only way is to open the record and look. I built a Chrome extension that collects that information while the record is on screen in the portal, so the data reaches the CRM without anyone keying it in.
The automatic sync is deliberately limited: it only updates what already exists and never creates anything. Opening a record out of curiosity must not produce new ones.
When a case stalls
The system notices on its own and warns whoever is handling it, then widens the warning to whoever is accountable. The thresholds are configurable from the admin panel, except the one on the last step: the person working a case must not be able to extend, on their own, the time before somebody else finds out. The clock does not restart from when the case was created, but from the last sign of life recorded in the system.
How I work on this project
Every change starts from a real case reported by the client. Before writing it I measure it against real data, and I release it only if it does not make what already works any worse.
The first example is about measuring. Every year the institutions republish the same courses under a new code, so the system has to work out on its own that the course just loaded is the new edition of one already there. I wrote the function that pairs them, comparing name, institution and course type, and before wiring it to anything I ran it against the real catalogue: of seven proposed pairs, four were wrong. The system was pairing courses whose names looked alike, which turned out to be far too fragile a rule. So I added three more checks, and on the next run every proposed pair was right.
The second is about not making things worse. Another report had led me to a rule that was wrong, and fixing it took one line. That line, though, would have created a bigger problem than the one it solved: the system would have lost the link to cases already archived and recorded them a second time. I corrected the rule only after adding the guard that keeps that link.
What is underneath
Five roles and twenty-two permissions that switch on one by one, with a per-user override that always beats the role. An automation engine configurable from the panel, twenty-three events, with a dry run that shows recipients and text without sending anything. Automations that must fire exactly once are protected by an atomic lock, not by a check that can arrive too late. Mail and documents go through Microsoft Graph, chat through Messenger and Instagram Direct. Commission is calculated according to the rules the client configures, with a guard that prevents paying twice.
In production, with more than 90 documented releases since April 2026. It was not delivered and closed: it is under continuous maintenance and development.
Stock control for a clothing company. Polidoro Group were tired of stock figures being wrong, and wanted to see at a glance what was available and what needed reordering. Hence the brief: something fast, always to hand in the warehouse, simple to use, and keeping a record of every operation. The record was there from the very first request, and that detail is what tells you the real problem: they needed to know who had moved what, and when.
I kept only what was needed and left everything else out. No prices and no product photos, because this is a stock warehouse and not a shop. No cloud, because the warehouse is an industrial unit with a local network. No hardware to buy: the operators use the phones already in their pockets, and the laser printer was there. Everything left out is one less thing to configure, and one less thing to explain to somebody working on the warehouse floor.
When goods arrive, the item is created from the desktop: brand, original code, model, colour, size, opening stock, minimum threshold and shelf position. The internal code is not typed in, though. The system builds it from the original code, the colour and the size, and out comes CD0881-GIBL-3XL. A warehouse worker typing a string like that by hand will get it wrong sooner or later, so nobody has to type it.
Labels stack up in a print queue that lives in the database, not in the browser session: close the app and the queue is still there, and it does not empty itself after the download, so if a sheet comes out crooked you reprint without redoing the work. The PDF comes out with 24 labels to an A4 sheet, 70 by 37 millimetres each. Every label carries its QR code, four lines of text and a coloured band matching the garment, so it can be recognised without reading.
The QR code does not hold the internal code, but an address with a stable identifier for the item. If that code changes tomorrow, the labels already printed and stuck on keep working.
Then the operator opens the phone camera, points it at the QR, taps the banner that appears and lands on the item: plus one, minus one, or a quantity with a note. Five or six seconds in total.
The scanner I removed
I did build a QR scanner inside the app, and then I took it out. Using the camera from inside a browser needs HTTPS, and on a local network that means certificates installed by hand on every operator's phone, or a dedicated domain, or going into the client's DNS. I looked at all three roads and dropped them: too much setup for a feature that was slower anyway, ten or fifteen seconds against five. The phone's own camera has nothing to configure. I deleted the scanner code and its tests rather than leaving them sitting there switched off.
When two operators touch the same item
Every movement is a delta, never an absolute figure: nobody writes that there are now nine, they write minus one. Two operators each taking one piece produce two separate movements, both in the log, with who, when, from which device, and the resulting stock level captured at that moment. Each movement is also a single transaction: either the stock level and the log are updated together, or nothing moves. Stock cannot go below zero, and a withdrawal larger than the stock is refused with a message in plain language rather than a negative number.
The database runs in WAL mode, so readers do not block writers: while one operator records a movement, the owner's dashboard and the other phones carry on reading. The real-time event goes out after the write is confirmed, so no device ever sees a movement appear that then turns out not to exist.
Where it runs and who uses it
Two roles. The owner works from the office PC, which is also the server: the app opens with a double click into a window with no address bar, so a technical address never comes up. From there they do everything, items, colours, label printing, users, dashboard. Operators log in from the phone only, with a username and a numeric PIN, a thirty-day session, and they can do exactly one thing: open an item and change its stock.
Everything stays on the company network: nothing exposed to the internet, no VPN, no cloud. The system answers when the office PC is on, which is during working hours, and that was stated to the client before starting rather than discovered afterwards. Installing it on that PC takes three or four minutes from a USB stick, with a repeatable script, and every evening at 19:00 an automatic backup runs, keeping thirty days of copies.
First commit on 29 April 2026, in production on 8 June. It has not stood still since: there has been the bulk correction of a wrong original code, with internal codes regenerated down the chain, and optimisations to the real-time updates.
502automated tests
<1ssync between devices
24labels per A4 sheet
python 3.11fastapihtmxsqlitereportlabpwa
Marketing Hub my own tool · in use every day
At some point SEO work across several clients stops fitting in a spreadsheet. The usual road, once you get there, is to pay for a platform that decides how you have to work. I preferred to work out what I actually needed and build it.
Marketing Hub is the working archive of my job: for every client, in one place, the editorial plan, the inventory of the site's pages, the tracked keywords, the competitors and the real figures read from Search Console and GA4. It is not a product and it is not for sale. It runs on my own machine, it has no login and no users, because the user is me.
What the agents are allowed to touch
I am not the only one filling this archive: the agents I work with write into it. They save an article, update keywords, record an analysis. The hard part was not getting them to write, it was deciding what they are not allowed to touch. Try asking.
waitingPick a request above.
What fills itself in, and what I write
The numbers fill themselves in: sessions and page views from GA4, impressions, clicks and position from Search Console, and the real titles and descriptions of the pages, read straight from the site. I write everything else, which is everything that takes a judgement: why an article should exist, who it speaks to, where it has got to, what I learned when it went wrong.
The history of every article is written by hand too, one event at a time: a hundred and thirty-five entries, one after another. No application knows how to record on its own the reason why something happened.
How it is built
Flask and SQLite behind, and in front a single-page interface in JavaScript with no framework and no build step: you edit a file and reload. The database runs in WAL mode, and that is not a technical detail dropped in for show: it is what lets an agent read it while the app is open, without either of them waiting for the other. It is the first line of the schema, so living alongside the agents was a decision taken at the start and not an afterthought.
From one client to every client
At first I had designed it to follow a single client. When I started taking on others I generalised it: the domain and the brand signals no longer live inside the analysis logic, they are passed in from outside, client by client. It is the work that shows the least and matters the most, because it is what separates a tool that works once from one you can use again.
19,700lines of code
61internal routes
20screens
pythonflasksqlite (wal)javascript, no frameworksearch console apiga4 api
Photos
This gallery holds screenshots of the software and the websites I have developed, and of the ones I contributed to.
click a thumbnail to open the image together with its technical details
Changelog · career
My story in the format I know best: release notes.
v2026.7not released yet
PLANNED · the next release: a role in a company, or a project, somewhere between SEO, development and teaching. What counts is the project I get to bring all of this to, not the shape of the contract.
v2026.6
CRM FAMA: continuous releases, more than 90 documented versions since April
This portfolio, with no frameworks and no libraries
v2026.5
Lidomatic launched and sold to its first customers: 2 beach clubs in production
Warehouse v1.0.0 shipped to Polidoro Group (6 weeks, 502 tests)
v2026.2
polodidatticofama.it: an article published the day after applications opened for the Italian supply teaching lists takes 29,823 impressions and 976 clicks in 5 days
v2025.9
Programming teacher at Coding Giants: classes from age 6 to 18, through to September 2026
Lidomatic begins: research and development of the whole ecosystem, from the app to online booking, from the licence CRM to customer support
v2025.02022-2025 · the foundations
Degree in Computing for Digital Business (L-31) at Università Telematica Pegaso, 107/110: dissertation on how companies communicate social responsibility on the web, with De Cecco as the case study
4 certifications recognised by the Italian Ministry of Education, with UniD Formazione: SEO Manager/Specialist, SEO Copywriter, Inbound Marketing, AI for Digital Marketing
Teaching I teach · teenagers and adults
I teach five subjects, and they are the same things I work on every day. I do not tie them to an age: a for loop is explained to a six year old the same way it is explained to an adult retraining for a new job, and what changes is the delivery, not the subject. And if I cannot explain it to the six year old, it means I have not fully understood it myself.
ProgrammingFrom the first blocks to real code, for teenagers and for adults
Web developmentHTML, CSS, JavaScript, and how a site actually goes live
SEOResearch, content, structured data and measurement
AIUsing it in your own work without handing it the decisions
ComputingThe basics, for anyone starting from zero, at any age
SEO and AI, not only code
These are the two subjects where my own work is freshest. I do SEO every day on a live site, and a full year of that work is in here, measured and open to read: the polodidatticofama.it case. Teaching it mostly means teaching the part that usually gets skipped: how you measure, how you check a source before publishing it, how you tell whether a number really says what it appears to say.
On AI I teach what I do: you give it the work, not the decision. I built Marketing Hub precisely to keep that boundary written down instead of remembered. Anyone using AI without knowing the subject cannot tell when it is wrong, and recognising that is exactly the part that has to be taught.
Who I teach, and in what format
Teenagers and adults, one to one or in a classroom. They are two different jobs. One to one you move at the pace of the person in front of you, you go back as many times as it takes, and the lesson gets rewritten while you teach it. In a classroom you need a plan that holds up even when half the group is ahead and the other half has fallen behind, and that is where the tools earn their place: the themed quizzes and timers I built for my own lessons.
Where I have already done it
From September 2025 to September 2026 I was a programming teacher at Coding Giants: classes of children and teenagers from 6 to 18, every week, for a year. Outside that I work one to one with adults on web development. They are the two ends of the same thing, and it is why I do not keep the younger audience separate from the adult one.
5subjects I teach
1 yearof classroom teaching
1:1 and classthe two formats
About me, and how I work
AlbertaOSversion 26.6
I develop websites and software that I stay with the whole way: I talk to the people who will use the program, write the code, put it into production and then keep looking after it, because business software that people use every day is never finished.
RoleSEO Specialist and full-stack developer
Based inLanciano (CH), in Abruzzo, Italy, and remote
EducationDegree in Computing for Digital Business, 107/110
CertificationsFour ministry-recognised certifications in 2025, across SEO, inbound marketing and AI
In productionFour projects: one of my own, three for clients
LanguagesPHP, TypeScript and Python, one for each system I have in production
TeachingProgramming, web development, SEO, AI and computing basics, for teenagers and adults
Background processes
graphicsvideo gamesGame of ThronesThe Lord of the Rings
I have not always written code. I left school with a diploma in business studies from the P. De Giorgio institute, a subject I never felt was mine: what I loved was computing. For years I worked in a completely different field, and that interest went nowhere in the meantime: it was only waiting for me to make room for it.
As the mother of two children, and with my husband pushing me on, I went back to studying. I studied in the mornings, while they were at school. Eighteen exams, and the syllabus already said what work I would end up doing: programming, algorithms and data structures, databases, networks and cybersecurity, computer architecture, software engineering, web technologies, cloud computing. Alongside them, digital communication, marketing and law for digital business. Development and marketing inside the same degree, which is exactly the pair I work with now.
A degree in Computing for Digital Business, 107/110, with a dissertation titled "Communicating social responsibility through the web: the De Cecco case as an applied model". In the same year, four ministry-recognised certifications with UniD Formazione: SEO Manager and Specialist, SEO Copywriter, Inbound Marketing, AI for Digital Marketing. They are the same skills I apply every day in my work, and two of them, SEO and AI, are also among the five subjects I teach.
Lidomatic in production at two beach clubs, the website and the CRM of a university guidance centre, stock control software for Polidoro Group. And I teach programming, web development, SEO and working with AI, to teenagers and adults.
Every paragraph in this section comes out of something I learned on one of the projects in this portfolio.
I start from the problem, not from the list of features
A request almost always describes a solution. The real problem sits underneath it, and at the start my job is to listen until it surfaces, talking both to whoever is commissioning the program and to whoever will use it. For the stock control software I had been asked for something fast, simple and always to hand, but the list also mentioned keeping a record of operations: that was the point, because it meant nobody knew who had moved what, or when.
What I leave out
Out of that warehouse system went prices and product photos, the cloud, and any hardware to buy: it is a stock warehouse inside an industrial unit with a local network, and everything left out is one less thing to configure and one less thing to explain to the people working there. I had even built a QR scanner inside the app. Then I removed it, because it would have needed a certificate installed on every operator's phone and it was slower than the camera everybody already has in their pocket. Not everything that can be added to a piece of software should be. Sometimes designing well means working out what is not needed, and having the nerve to take it out.
Small releases, and nothing that makes what works any worse
The CRM has passed ninety documented releases since April 2026. There are many because I choose to work in small releases: keeping each change contained makes its effects easier to check and lowers the risk of introducing regressions into software already in production.
And this is a principle I always follow: a change must not compromise what already works.
Once, for instance, a one-line fix solved the reported problem but introduced a worse regression: the system would have lost the link to cases already archived. It is precisely to catch cases like this that I keep a suite of automated tests alongside the development: 1,595 tests on Lidomatic, 564 on the CRM and 502 on the stock control software.
I check the figures before publishing them
On 3 August 2026 I spent a day checking the figures that were going to end up in a set of articles. In the end I threw four of them out: employment data from a consortium that none of the institutions mentioned belongs to, an American study from 2009 presented as current, a regulation that does not exist, and a course attributed to the wrong institution.
Most likely nobody would have noticed. And that is exactly the point: a piece of content can look correct and still carry wrong information. Which is why the checking comes before publication, not after.
The same standard applies when I present the results of my own work. In the SEO case study, for example, I could have picked the most flattering period to build a better comparison. I did the opposite: July 2025 against July 2026, knowing that July 2025 had been the best month of that year. If the result holds up even against the hardest figure to beat, the comparison is worth a great deal more.
Delivery is not the end
On Lidomatic I read the state of every installation from the CRM I built to follow them, remote diagnostics included, and I usually spot a problem before the client calls me. Updates install themselves. The guidance centre's CRM is under continuous maintenance and development, and the warehouse system, in production since 8 June 2026, has not stood still since. None of the three is a project that was delivered and closed.
I use AI every day, and I say so
I use AI every day and I would rather say it than hide it. For every project I have built dedicated agents and whole chains of work, from research through to verification. But AI is the arm: I choose the architecture, I write the instructions, and I check every result before it goes into production. It does not decide, I decide. Anyone who knows the subject gains a multiplier from it; anyone who lets it run unchecked ends up with a mess.
I do not keep that boundary in my head, it is written down inside Marketing Hub, where the agents' permissions are a table: what they can write on their own, what they have to ask me about, what they must never touch. On that app's page you can try the permissions panel yourself.
I develop SEO-optimised websites and software that I take into production and keep releasing. I use AI agents built for each project: the architecture, the decisions, the strategy and the checking stay mine.
Roles I am looking for
Project ManagerSEO SpecialistDigital marketingFull-stack developmentDev + SEOTeaching and training
A complete management ecosystem for beach resorts: application, online booking, licence-key CRM, customer support. In production at 2 beach clubs, 1,595 automated tests. TypeScript, React, Electron, Cloudflare.
CRM FAMA
Full-stack development2025 - present
A CRM for university guidance across several education providers: leads, enrolments, commission, automations, social inbox, Chrome extension. More than 90 documented releases (now at v96). PHP, Laravel, Alpine.js, MySQL.
polodidatticofama.it
Website development and SEO strategy2025 - present
Website, content and editorial plan for a university guidance centre, with a custom-built analytics dashboard. Since the editorial work began, organic traffic has gone from 74,000 to 322,000 impressions a month and first-page queries from 379 to 5,551 (July 2025 against July 2026). WordPress, GA4, Search Console, Python.
Warehouse software
Design and development · Polidoro Group2026
Stock control for the clothing sector with QR labels and real-time sync between devices. To v1.0.0 in 6 weeks, 502 tests. Python, FastAPI, HTMX.
Coding Giants
Programming teacherSep 2025 - Sep 2026
Weekly teaching to classes from age 6 to 18, with the quizzes and lesson timers I built myself.
Dissertation: "Communicating social responsibility through the web: the De Cecco case as an applied model".
Four ministry-recognised certifications
SEO, Inbound Marketing, AI2025
SEO Manager & SEO Specialist, SEO Copywriter, Inbound Marketing, AI for Digital Marketing.
Web Designer, Programma GOL
Training course2023
Contact
The most direct way is to write to me from here: fill in the form and the message lands in my inbox, without going through your own mail client. I reply within 48 hours.
What happens next
If the request is about software, the first thing I ask is not what the program should do, but what the problem is right now: almost every time, the answer changes what needs building. That is where everything else starts, and I have written it out in full in how I work.
Where I am, and how far I go
I am in Lanciano, in the province of Chieti, Italy. I work remotely across the whole country, and from abroad as well. On site or hybrid, I cover Abruzzo, Marche and Molise.
Website, content and SEO strategy for a university guidance centre. The first thing I did, on 27 January 2026, was install GA4 and submit the sitemap to Search Console the same day: first you put the measure in place, then you work. Everything that follows is measured from there.
Polo Fama asked me to rebuild their website from the ground up. I started by taking stock of the pages to know what was already there, sorted them into ten topic clusters, and between February and August 2026 published nineteen new articles. I chose to write the articles in HTML, so that I decide myself how the structured data goes in rather than leaving it to the page builder. Along the way the site stopped being only pages to read and became an interactive ecosystem, with several guidance tests, a tuition fee simulator, a direct link into the CRM FAMA for anyone filling in a form or signing up to the newsletter, and a good many other tools you can see at polodidatticofama.it.
real Search Console data, web search · same month, one year apart
The comparison above puts July 2025 against July 2026, and I chose it because it is the one that flatters me least. July 2025 had been the best month of that year, so the comparison starts from the highest point available and the growth that comes out of it is four times over. Had I picked April, which went badly in 2025, exactly the same growth would have looked eight times over. Same work, double the number, changing only the month you start from: which is why a multiplier on its own means nothing unless you know where it starts.
Then two things that case studies usually leave out. The first: the site now appears far higher up, with average position moving from 13.4 to 6.8, that is from the second page of results to the first. Over the same period, though, the share of people who click when they see it went down, from 1.63% to 1.42%.
There are at least three plausible causes, and the available data cannot separate them. The results page is more crowded than it was a year ago: above the organic links there can be paid ads and AI-generated panels, and in both cases the searcher finds an answer before reaching the site. There is also a composition effect, because as the site grew it started appearing on many more informational searches, where people read rather than click. And there is a measurement artefact: an improving average position can hide a tail of appearances in ninth and tenth place, where clicks are close to zero by nature. Anyone claiming to know which of the three weighs most is guessing. What you can do is say so, and keep measuring.
The second: part of the growth is the calendar and not merit. The biggest month of the year is March, and March falls inside the window when teachers submit their applications for those same lists. That demand would have existed anyway, with me or without me.
What the calendar does not explain, though, is the rest of the year. The pages on the site fall into two groups: those that live on deadlines, such as calls, ranking lists and teaching qualifications, and those that have none, such as what a degree costs or which course to choose. If the growth had been seasonal alone, the first group would have grown most. The opposite happened: pages with no deadline grew 5.1 times over, those with one 4.8.
Two articles, two different mechanics
On 24 February 2026, one day after applications opened for the Italian supply teaching lists, I published a guide to the IT certifications that earn points on them. In five days: 29,823 impressions, 976 clicks, average position 5.8. The credit here is not the volume, which the deadline would have brought to somebody regardless. It is that on that day the page was already online.
On 24 July 2026 I published an article on the reform of the biologist profession, and something different happened. That article got into Google Discover, where nobody is searching for anything and the content is put in front of people as they scroll: 1,997 clicks in four days, with a click-through rate of 8.9%, six times the one from search. It has happened once in sixteen months of data, so I do not call it a channel I have a hold on. The interesting part comes afterwards: in search, rather than fading, that article kept gaining positions for three weeks. The first piece catches a deadline, the second builds a position.
How I decide what to write
Not from a list of headlines, from a calendar of audiences. Each month has one: the person checking the cost before enrolling, the one who has to qualify to teach, the one who works and goes back to studying at forty. That is what the ten clusters are for, and taking stock of the 340 pages is what tells me what already exists before adding anything.
There is also a rule about sources, and it is the part of the work that shows least. On 3 August 2026 I spent a day checking the figures that were about to go into the articles, and threw four of them out: employment data from a consortium that none of the three universities belongs to, an American study from 2009 quoted as current, a regulation that does not exist, and a course attributed to the wrong university. Nobody would have noticed. It is why every figure in those articles has a date next to it.
The tool I run the plan with
The plan does not live in a spreadsheet. I built Marketing Hub, a Flask application with a SQLite database: every article moves through seven stages, from idea to monitoring, and next to each one sit its own performance figures, read from Search Console and GA4. In the native interfaces those two things live in different products and never meet. Here the performance of a query and the working state of the article chasing it appear on the same screen.
 AlbertaOS
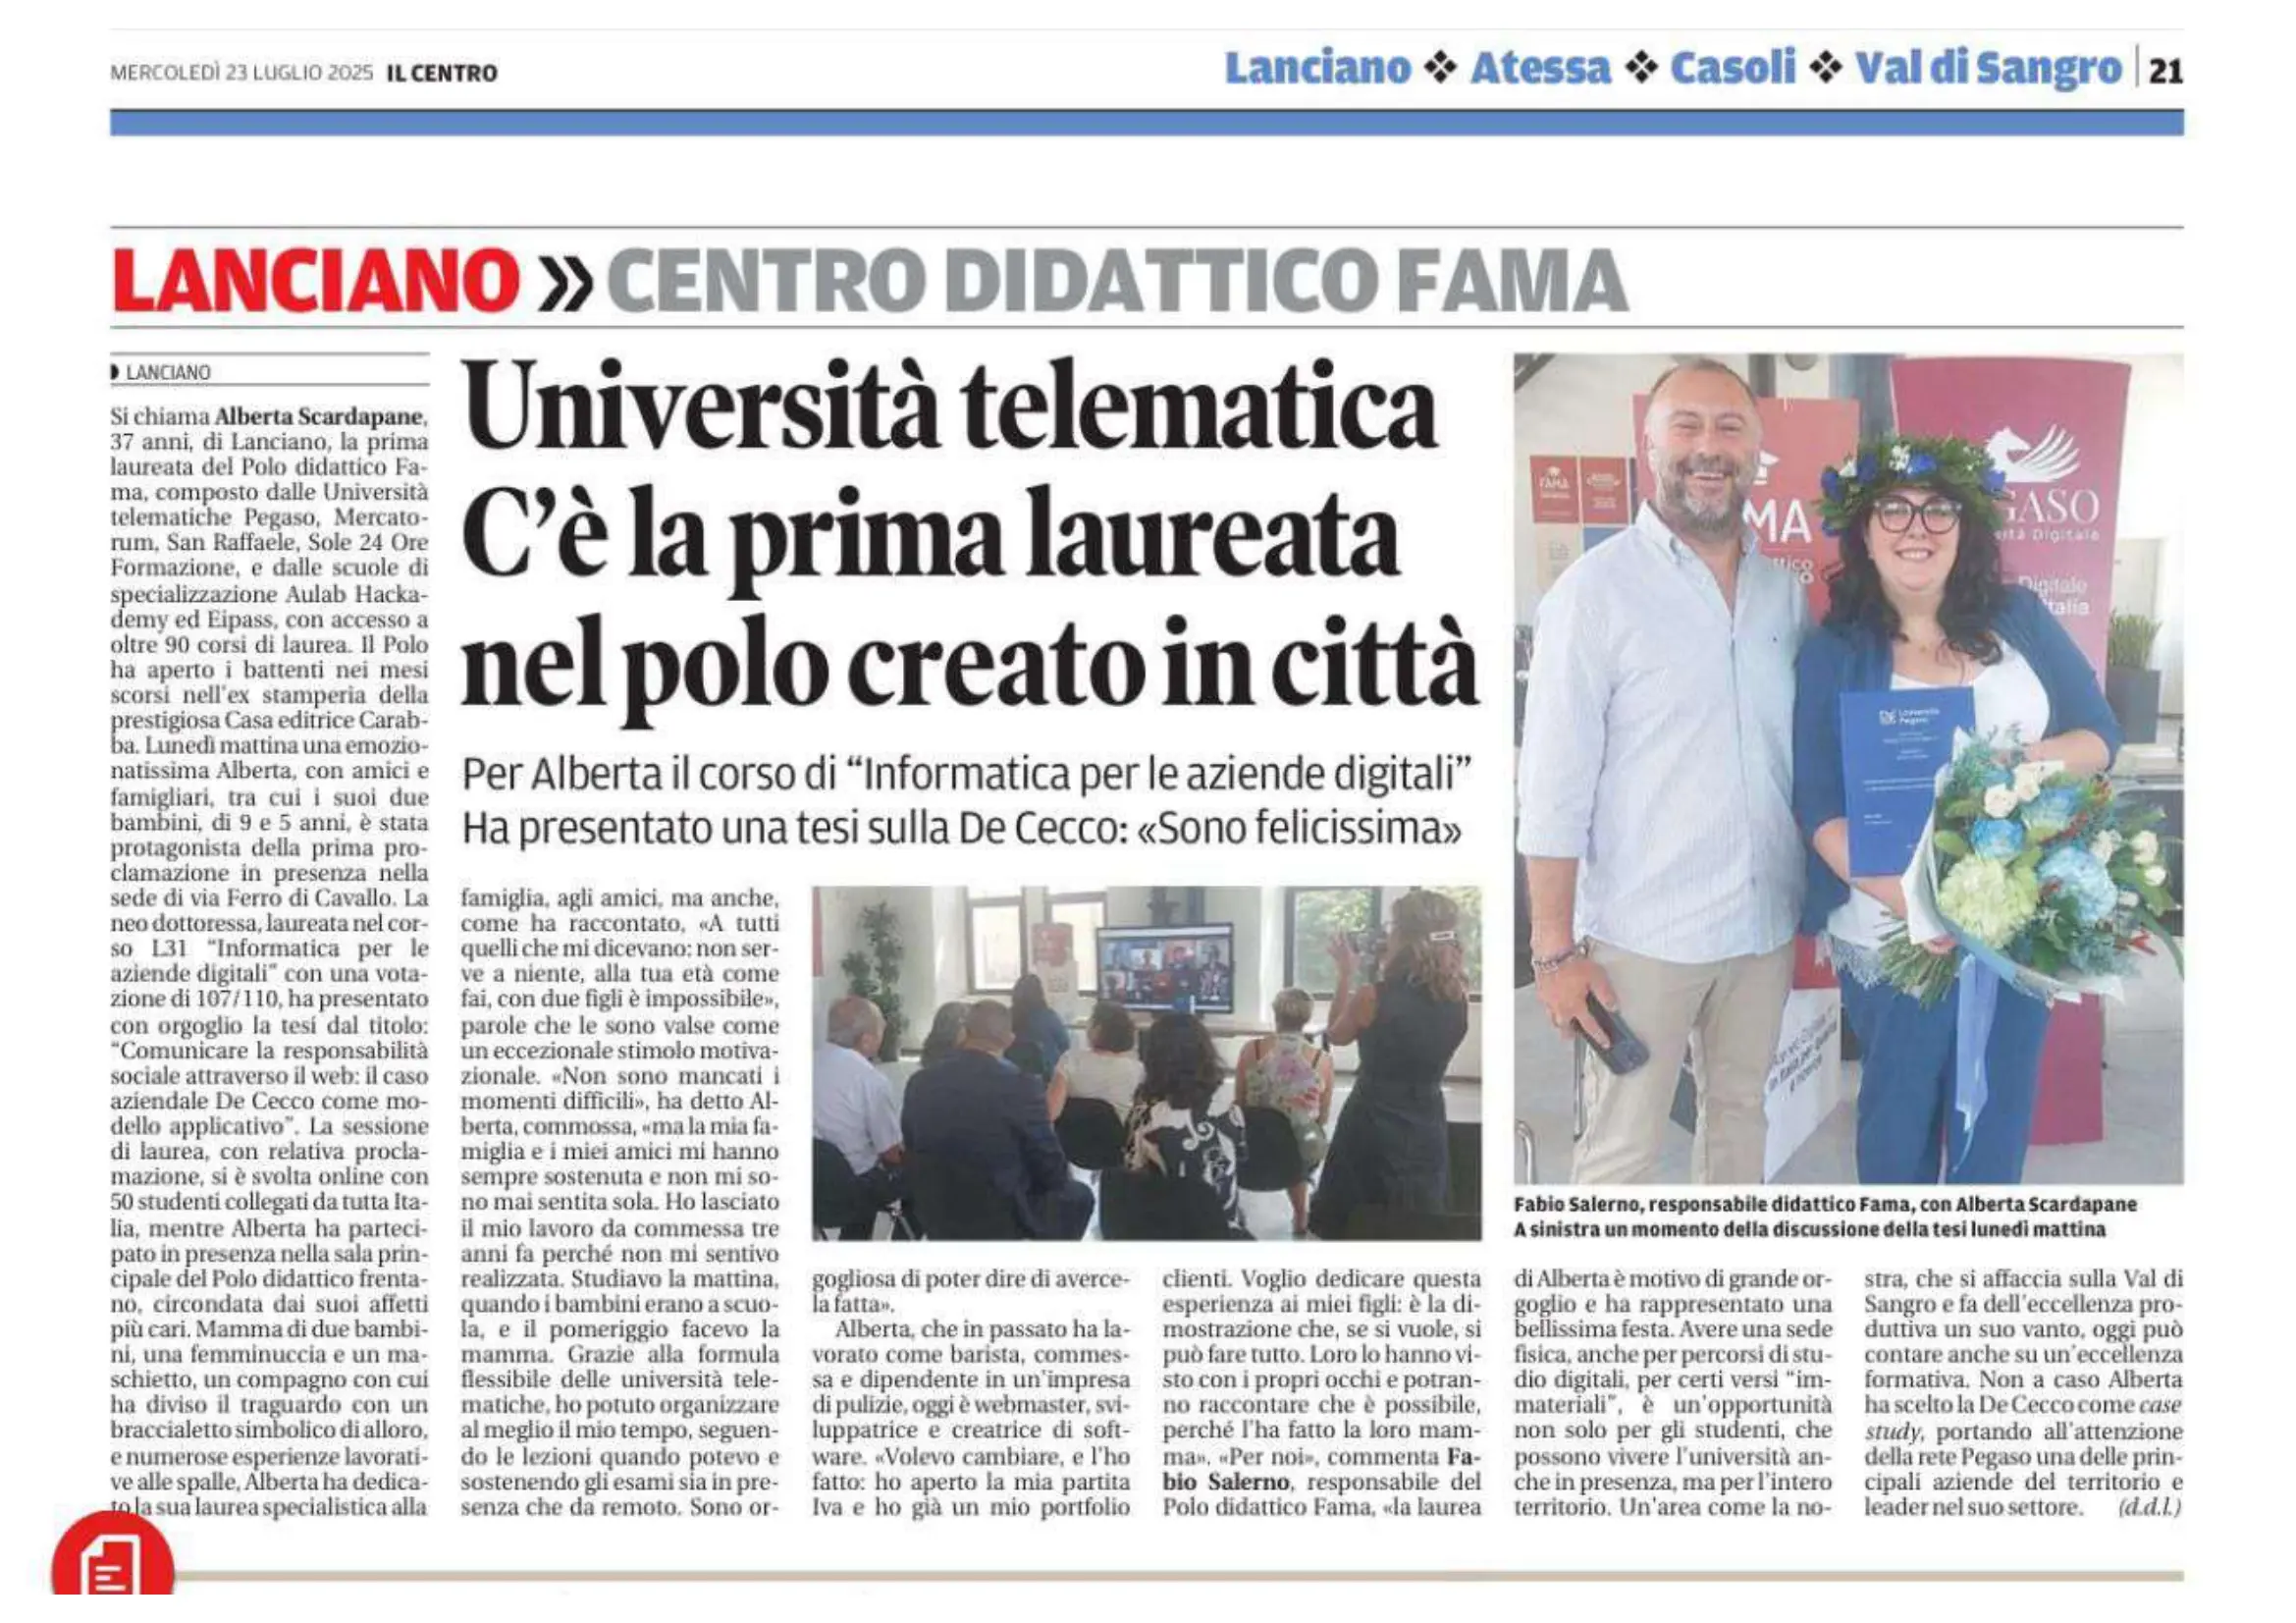 Il Centro · 23 July 2025, page 21Università telematica, c'è la prima laureata nel polo creato in città (Online university: the first graduate of the centre set up in town)open the full-size page